Spotify vs Apple Music: Which Platform Pays Artists More?
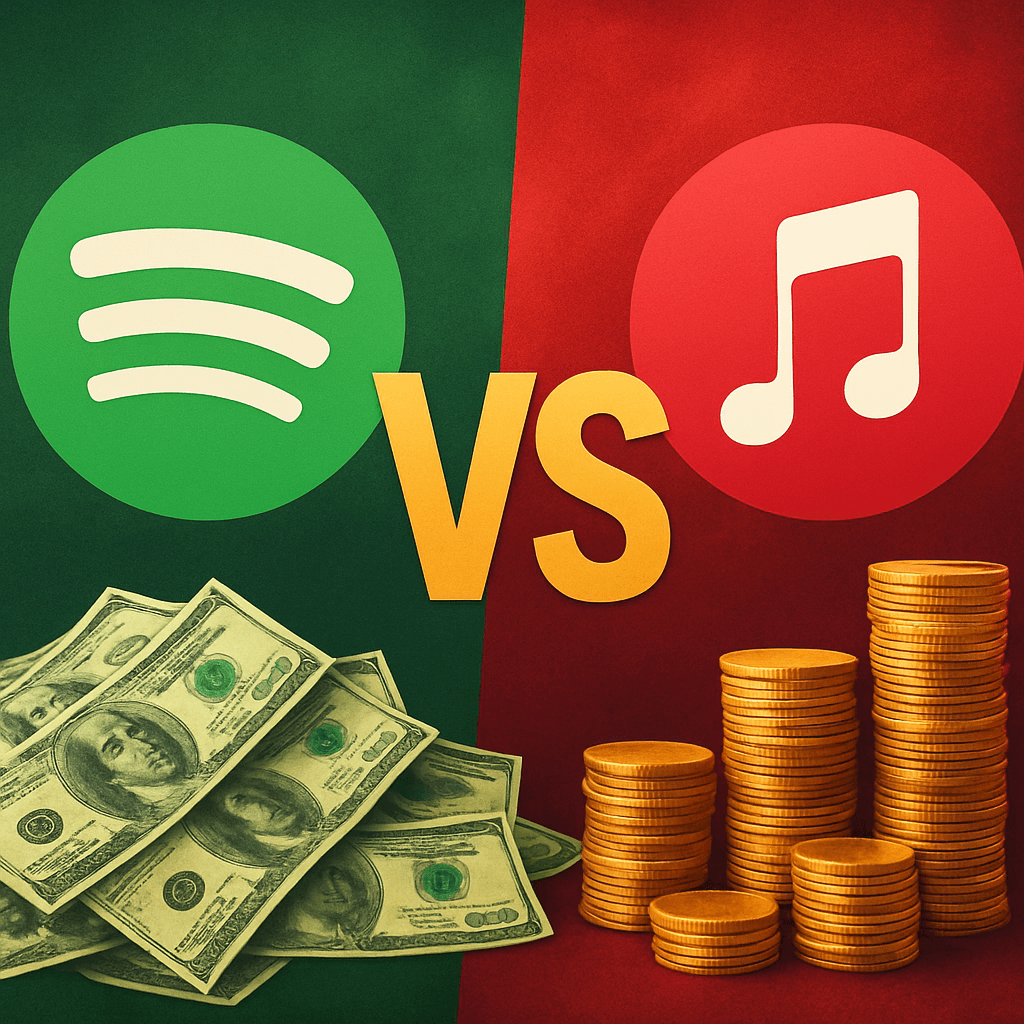
Spotify vs Apple Music royalties is a debate in every music community, but the reality is messier than a single per-stream number. This comparison lays out sourced per-stream ranges, explains how master and composition splits and distributor deals change net pay, and walks through worked examples for independents and label-signed artists. Read on to get realistic earnings estimates, the assumptions behind them, and specific actions to increase your streaming revenue.
1. How streaming royalties are generated and where the money flows
Start with what you already earn. The money your music generates on Spotify or Apple Music is not one payment to you — it splits into two parallel rivers: payments for the sound recording (the master) and payments for the songwriting (the composition). Which river reaches your pocket depends on who owns the rights, who collects them, and the contracts sitting between you and the platform.
Master versus composition: who gets what
Master payments go to the owner of the recording, usually a label or the distributing independent artist. Composition payments go to songwriters and publishers and are collected by performing rights organizations and mechanical rights entities. In the US the main collection points are SoundExchange for digital performance of masters and the MLC for mechanicals; for performance royalties you have ASCAP, BMI, or SESAC. In the UK those roles are handled by PRS and PPL, in Germany by GEMA and GVL.
Practical insight: the platform sends a gross revenue pool, but you rarely see gross. Labels, distributors, and publishers take their contractual shares before you get paid. That means a higher gross per-stream on Apple Music can still translate to lower net pay for an artist with an unfavorable label deal or unpaid publishing splits.
- Platform collects revenue: money comes from subscriptions and ads, tracked by the service.
- Gross pool is split: part allocated to master owners, part to publishing pools depending on local licensing rules.
- Collecting societies distribute: SoundExchange, ASCAP, BMI, PRS, GEMA, MLC and local mechanical bodies route money to rights holders or payers like labels and publishers.
- Final net to artist: reduced by distributor fees, label recoupment, publishing splits, and admin costs.
Pro rata versus user centric matters. Most services, including Spotify and Apple Music, use a pro rata model: all subscriber and ad revenue is pooled and paid out based on total streams share. That concentrates payouts to the most-streamed tracks. A move to user centric payments would shift money towards niche artists with dedicated listeners. This is not hypothetical policy; it changes how playlists and small fanbases convert into income.
Concrete example: If you earn a blended gross of 0.0035 USD per Spotify stream and 0.008 USD per Apple Music stream, 100,000 streams would gross about 350 USD on Spotify and 800 USD on Apple Music. If you distribute independently through a flat-fee service you might keep 80 to 90 percent after distributor fees for the master, but a signed artist with a 15 percent royalty on net receipts could see the same gross reduced to roughly 120 USD to 180 USD depending on label accounting and publisher shares.
Key point: gross per-stream differences between Spotify and Apple Music matter, but rights splits, distributor terms, and collection pathways determine what actually reaches you.
One judgment most artists miss: chasing platforms because of reported per-stream rates is often the wrong move. Fixing metadata, claiming uncollected recordings, and sorting publishing will usually increase your take-home more reliably than switching where you distribute. For details on registrations and collecting services see SoundExchange education and our guide on mechanical versus publishing royalties at Royalties de l'édition musicale vs. redevances mécaniques | Blog UniteSync.
2. Business model differences that drive per-stream economics
Unclaimed royalties
Your streams generate royalties. See how much is going unclaimed.
If you are wondering why the same million plays earns different money across platforms, the answer lives in the business model, not magic. Spotify vs Apple Music royalties differ mainly because the services sell different products to listeners and then pool revenue differently. That affects the average money sitting in the pot per stream before any label or publishing split.
How product mix changes the size of the pot
Paid subscriptions concentrate revenue. Apple Music is almost entirely subscription based which means more of its listening comes from paying users. That raises the platform level revenue per stream and is a big reason why estimates put Apple Music gross per-stream averages higher than Spotify.
Ad supported listening dilutes average payouts. Spotify has a large free tier that generates ad revenue rather than subscription fees. Ad revenue per listener session is lower and more variable, which pulls down Spotify vs Apple Music royalties when you look at blended averages reported by analysts and industry sources like IFPI 2023 and Spotify filings at Spotify Investor Relations.
Practical mechanics that matter to your payout
- Revenue pool origin: Money comes from subscriptions or ads. Subscription pools are larger and steadier per user.
- Subscription plan mix: Student and family plans pay less per seat than full price subscriptions. A catalogue heavily streamed by family plan users will see lower effective per-stream revenue.
- Regional ARPU differences: Paid markets like US and UK pay better than many emerging markets because subscribers there pay higher prices.
- Editorial and discovery effects: Spotify free tier drives discovery. Exposure tradeoffs can mean more total streams on Spotify even if each stream is worth less on average.
Tradeoff to accept. Apple Music tends to pay more per-stream but gives you less free-discovery engine compared with Spotify free tier. If you rely on organic discovery to build fans, the exposure benefit on Spotify can translate into more total streams and ancillary income even if Spotify per-stream is lower.
Concrete example: Suppose paid streams pay roughly 0.010 USD and ad streams 0.001 USD. If 90 percent of Apple Music streams are paid, the blended per-stream is about 0.009 USD. If Spotify has a 50 percent paid mix, blended becomes about 0.0055 USD. For 100,000 streams that gap is the difference between 900 USD gross and 550 USD gross before any label or publishing splits.
| Characteristic | Spotify | Apple Music |
|---|---|---|
| Primary revenue source | Subscription + large ad supported free tier | Primarily paid subscriptions |
| Blended per-stream tendency | Lower, variable due to ads | Higher, steadier from subscriptions |
| Discovery advantage | Stronger via free tier and algorithmic playlists | Weaker free discovery; more premium audience |
If you want to dig deeper, compare platform revenue disclosures and subscriber mix in public filings and use your dashboard data to see what share of your plays come from paid listeners. UniteSync can help reconcile where those paid plays converted into actual collections across territories; start by checking registrations and metadata accuracy so higher per-stream pots actually reach you.
3. Published per-stream ranges for Spotify and Apple Music and how to read them
If you check the published figures you will find ranges, not guarantees. Industry summaries commonly place Spotify around 0.003 to 0.006 USD per stream and Apple Music around 0.007 to 0.012 USD per stream — these are blended gross estimates used by analysts and press, not platform promises to individual rights holders. See coverage from Music Business Worldwide and Spotify financials at Spotify Investor Relations for the numbers behind those ranges.
| Platform | Common published blended gross range (USD per stream) | What that range hides |
|---|---|---|
| Spotify | 0.003 to 0.006 | Blends paid subscriber streams and ad supported streams, varies by territory and time period |
| Apple Music | 0.007 to 0.012 | Mostly paid subscribers so the average skews higher, but still gross before rights splits |
How to read a per-stream number
- Gross versus net: Published rates are gross platform payouts. Net is what reaches you after label or distributor cuts, publisher splits, collection costs, and recoupment.
- Paid versus ad-supported: A single Spotify stream from a paid subscriber can be worth multiple times an ad-supported stream. Always ask what mix the estimate assumes.
- Territory matters: Currency conversion, local licensing deals, and country market rates change effective value by a large margin.
- Plan types and bundles: Student, family and telco-bundle subscribers pay less per user which drags the blended rate down.
- Timing and unclaimed royalties: Some money sits with collection societies or remains unclaimed; headline rates assume full collection, which is often optimistic.
Concrete example: Suppose a Spotify paid stream is valued at 0.006 USD and an ad-supported stream at 0.001 USD. If 60 percent of your Spotify plays come from paid users and 40 percent from ad users your blended per-stream is 0.004 USD. On the same 100,000 plays Apple Music at a 0.008 USD paid-only rate would pay 800 USD gross, versus 400 USD gross on Spotify under that mix. After a typical distributor cut and publishing splits the real difference narrows further.
Important: published per-stream figures are useful for rough planning but dangerous if used alone to pick a platform. Rights splits and listener mix usually swing your final payout more than a few tenths of a cent.
Practical trade-off: If you have a concentrated, engaged fanbase that mostly uses one service and pays for subscriptions, optimizing for that service can pay off. If your audience is diffuse across free tiers and regions with lower rates, chasing a single platform because its headline per-stream rate is higher is unlikely to move the needle. User centric proposals could change the math for niche artists, but that is not the current industry default.
4. Realistic worked examples: independent artist versus label signed scenarios
Concrete point: For the same number of streams, an independent artist distributing directly will usually keep many times more cash than a comparable artist on a typical major label split — even though Apple Music pays more per stream than Spotify. The platform gap matters, but rights splits and distribution fees are the real multiplier.
Assumptions used in these worked examples
- Streams used: 1,000,000 streams as a round test case.
- Per-stream gross: Spotify = 0.0035 USD, Apple Music = 0.008 USD (blended estimates; see Music Business Worldwide for ranges).
- Master revenue only: These calculations show money that flows to the recording owner. Publishing and writer income is separate and must be registered with PROs and SoundExchange to collect; see SoundExchange education for US performance pay.
- Independent distribution: assumes a 9 percent distribution fee (CD Baby style) as a simple proxy. If you use DistroKid with a flat subscription, your percentage retained may be higher.
- Label deal: assumes an artist royalty of 15 percent on label net receipts and no additional offsets in the worked example. Real deals include recoupment, reserves, and separate deductions; use this only as an illustrative baseline.
| Scenario | Platform | Gross per-stream | Streams | Gross revenue | Artist take (master) |
|---|---|---|---|---|---|
| Independent (9% distributor fee) | Spotify | 0.0035 USD | 1,000,000 | 3,500 USD | 3,185 USD (3,500 x 0.91) |
| Independent (9% distributor fee) | Apple Music | 0.008 USD | 1,000,000 | 8,000 USD | 7,280 USD (8,000 x 0.91) |
| Label signed (artist royalty 15%) | Spotify | 0.0035 USD | 1,000,000 | 3,500 USD | 525 USD (3,500 x 0.15) |
| Label signed (artist royalty 15%) | Apple Music | 0.008 USD | 1,000,000 | 8,000 USD | 1,200 USD (8,000 x 0.15) |
Concrete example: A label offers a 10,000 USD advance and a 15 percent royalty. Using the Apple Music numbers above, the label receives 8,000 USD per 1,000,000 streams and would recoup roughly 1.25 million streams to cover a 10,000 USD advance. That math shows why advances look attractive but are often recovered quickly by labels on streaming income.
Practical insight and tradeoff: If you are independent, optimizing metadata, registering rights, and focusing promotion toward premium subscribers produces outsized gains because you keep most of the gross. If you are negotiating with a label, higher per-stream rates on Apple Music become a secondary concern to how the contract defines gross pool, recoupment, reserves, and whether the label deducts third party distribution fees.
What people misunderstand: Many creators assume per-stream differences between Spotify and Apple Music will change take-home pay dramatically. That is only true when rights ownership is comparable. In practice, a higher Apple Music rate rarely closes the gap created by a label split or aggressive distributor percentage.
If you want to test this against your real catalog, use these assumptions as a template and plug in your distributor fee, your actual per-stream reports by territory, and whether you own publishing. For help with publishing registrations see Royalties de l'édition musicale vs. redevances mécaniques and for per-stream ranges see Music Business Worldwide.
5. Factors that create wide variation between artists on the same platform
Plain fact: two artists with the same stream count on Spotify or Apple Music can receive very different payments because the context of those streams matters more than the raw number. This is the core reason the Spotify vs Apple Music royalties debate is noisy: platform averages hide listener mix, territory, rights ownership, and technical leaks that change what actually lands in your bank account.
Primary drivers of variation
- Listener mix and subscription tier: paid subscribers pay more per month than ad listeners, and family/student discounts reduce average revenue per user. A stream from a US paid user is worth much more than a stream from a free user in a market with low ad rates.
- Territory and currency effects: each market has different licensing deals and local collection flows. Currency conversion and local tax treatments can cut effective payouts when your money crosses borders.
- Playlist type and source of plays: editorial-curated playlists often drive stable, high-value streams. Algorithmic and user-generated streams skew differently; heavy placement on a high-Followers playlist dominated by passive listeners is not the same as deep listening from a small, engaged fanbase.
- Rights ownership and split complexity: publishing splits, co-writes, samples, and admin agreements determine how gross revenue is parceled. The more owners and middlemen, the smaller your slice.
- Metadata accuracy and unmatched plays: mismatched ISRC, missing writer credits, or wrong ownership info creates unclaimed or withheld pools. Those dollars sit in a pool or go to collection societies instead of you.
- Distribution deals, advances, and recoupment: label and distributor contracts define net pay. Two independents using different aggregators can still see very different net receipts because of fee structures and optional services.
- Reporting lag and holdbacks: some platforms or collection societies hold earnings for audits or to clear rights disputes, delaying or reducing immediate payouts.
Practical insight: fixing metadata and registration is the highest ROI action for most creators. In practice, cleaning up ISRC/ISWC, registering with local PROs and SoundExchange, and ensuring publisher-admin details are correct will often recover more lost money than trying to move traffic between Spotify and Apple Music.
Concrete example: Artist A and Artist B each get 100,000 streams. If Artist A's plays are 80 percent from US paid subscribers at a blended gross of $0.008 per stream, gross revenue is about $800. If Artist B's plays are 70 percent from low-ad-rate territories and ad-supported listening averaging $0.0015 per stream, gross revenue is about $150. If 15 percent of Artist B's streams are unmatched due to metadata errors, the real receivable drops further and may sit uncollected until fixed.
Judgment that matters: many creators obsess over small per-stream differences between platforms when the bigger, fixable leaks are on the rights and metadata side. Platform-level economics matter, but only after you control who owns what, how it is registered, and where your listeners are.
Next consideration: once you fix ownership and metadata, prioritize directing growth toward premium listeners and territories that pay better — but only after you measure where your current income is leaking. That ordering gives you the best chance to turn streams into real money.
6. Practical steps artists can take to maximize streaming income right now
Start with the money you already have. The fastest, lowest-effort wins come from fixing admin and reclaiming payments that are sitting unpaid because of bad metadata, missing registrations, or distributor errors. These moves cost little and compound every month.
Priority workflow — what to do this week, month, quarter
- This week: Audit for obvious leaks. Pull your latest distributor statements and streaming reports and check for missing ISRCs, missing songwriter splits, and territories with zero payouts. Use the distributor portal export and a simple spreadsheet to spot gaps.
- This month: Fix registrations that block payments. If you are not registered with a performing rights organization and SoundExchange in the US, do it now. Being registered does not guarantee payment, but not being registered guarantees you miss money. See SoundExchange education for US digital performance steps.
- Next 3 months: Reconcile and match rights. Get your recordings and compositions matched across services. Submit matchbacks for unclaimed uses to your distributor and PRO. If your distributor will not help, escalate or switch — small errors here compound across territories.
- Ongoing: Prioritize paid-listener strategies. Focus promotion where paid subscriptions are dominant for higher average per-stream value. Use your analytics to identify countries and playlists that deliver premium listeners and double down there rather than chasing volume in low-paying ad markets.
- Parallel: Convert a portion of listeners to direct revenue. Build or grow an email list, offer pre-saves tied to merch or early access, and push toward fan subscriptions or direct downloads. These moves diversify income away from thin per-stream payouts.
- Quarterly: Review distribution and fee arrangements. Compare your net receipts under your current distributor versus alternatives. Small differences in fees and additional collection services scale with catalog size.
Tradeoff to accept. Administrative fixes and smarter promotion both matter, but they require different investments. Fixing metadata is low time cost with high certainty. Large-scale playlist or market campaigns require budget and may not move per-stream values immediately. Allocate time according to expected return.
Tactics that actually move the needle
- Metadata clean up. Ensure ISRCs and writer splits are correct in the distributor and PRO records. Missing or incorrect data produces unclaimed royalties across multiple countries.
- Claim US digital performance via SoundExchange. This collects money paid to sound recordings separate from publishing. Many independents leave this on the table.
- Target paid-user playlists and editorial curators. Editorial placements on platforms with high subscription mixes yield more money per stream than algorithmic free-tier loops. Use your analytics to focus pitches where the platform shows a premium-user base.
- Localise promotion by territory. If Apple Music has stronger subscriber share in a market you perform well in, run concentrated ad buys or influencer campaigns there to capture higher per-stream dollars.
- Short release windows for discovery. Cluster releases so you can push a tour of promotional activity that increases first-week velocity and the chance of editorial placement.
- Audit distributor statements for hidden deductions. Look for unexpected administration fees, mechanical collection markups, or delayed payments and question them.
Concrete Example: An independent singer found repeated mismatched ISRCs between their distributor and a major playlist curator. After correcting the ISRCs and filing matchbacks with the distributor, they recovered about 8 months of delayed payouts and increased ongoing monthly receipts because future streams were correctly attributed to their account.
What most artists get wrong. Chasing a single platform because it pays more per stream is rarely the best move. You will lose discovery and listener growth if you restrict availability. Focus on administrative certainty and converting existing listeners into higher-margin revenue sources.
If you want a practical template for the audit and step by step reconciliation, see the UniteSync guide on collecting mechanical and publishing royalties for next steps and resources. Royalties de l'édition musicale vs. redevances mécaniques explains how to prioritize claims across territories.
Next consideration: After fixing admin leaks, run one focused marketing test aimed at paid listeners in a single territory and measure the change in effective per-stream revenue before scaling.
7. Practical takeaway: Which platform pays more for most artists and how to interpret that answer
Short answer: Apple Music generally pays a higher blended gross per stream than Spotify, but that headline does not reliably change what lands in your bank account. The real determinant is how your rights are split, where your listeners live, and whether those streams come from paid subscribers or ad supported listeners.
How to use that fact in real decisions
- If you keep most rights and distribute independently: prioritize reach over platform choice. Getting streams from both Spotify and Apple Music typically earns you more than removing your catalogue to chase a marginally higher per-stream rate.
- If your audience is concentrated in premium markets (US, UK, Germany): Apple Music will probably convert to higher gross receipts because its streams are more likely to come from paid subscriptions, so playlist targeting toward premium listeners can be worthwhile.
- If you are label signed or under a recouping deal: the platform difference often becomes irrelevant. Labels take a large share of the gross pool, so negotiate contract terms that define net pool and recoupment rather than which service pays slightly more.
- If you have a niche but loyal fanbase: watch for user centric pilots and curated playlist behaviour. A smaller set of devoted listeners on a paid plan can outperform mass exposure on a free tier.
Practical limitation to accept: per-stream ranges quoted for Spotify vs Apple Music royalties are blended and time sensitive. You cannot assume the higher number for every release, because marketing pushes, playlist inclusion, and territory mix change the effective rate for each release and each month.
Concrete example: Suppose you are an independent singer-songwriter with 70 percent of your listeners in the US and a healthy presence on editorial playlists. Even though Apple Music pays better per stream on average, the right move is to optimize metadata and playlist pitch across both platforms and focus promotional spend on converting free Spotify listeners to paid subscribers. A decision to leave Spotify would likely cut your total plays and reduce overall revenue despite a higher per-stream metric on Apple.
What people misunderstand: many creators treat per-stream amounts as deterministic. In practice the same million streams can yield wildly different outcomes depending on distributor fees, publishing splits, unclaimed rights, and whether the streams came from family plans, student plans, or ad supported listening. Fixing those backend issues usually delivers more extra cash than platform switching.
Next consideration: run a quick catalog check: map your top 10 tracks by territory, estimate paid versus free stream mix, and plug those weights into per-stream ranges from industry sources to model likely revenue. If you want a reproducible template, start with the worked examples earlier in this article and adapt the territory weights to your analytics.
8. Methodology, assumptions, and data transparency used in this comparison
Straight to the point: this comparison is a blended, gross-per-stream analysis meant to show differences before label, distributor, and publishing splits are applied. The numbers are useful for estimating platform-level economics, not the exact cash you will see in your bank account.
Data sources, timeframe, and what we blended
Primary sources: revenue and subscriber data came from Spotify annual filings and investor reports and IFPI and Music Business Worldwide analysis for per-stream ranges. For mechanics and US digital performance we used SoundExchange guides. See Spotify investor reports, IFPI Global Music Report 2023, Music Business Worldwide analysis, and SoundExchange education for methodology references.
- Time window: most source figures are current to 2022 2023 reporting cycles. Streaming economics shift fast; use the model below with fresh rates where possible.
- What we blended: paid subscription streams, ad supported streams, and a basic territory weighting in markets where sources reported different averages.
- What we did not blend: individual label deals, distributor commissions, publisher splits, recoupment, and sync or merchandising income.
Assumptions and limitations you must accept to use these numbers
Key limitation: platform gross per-stream estimates are not platform guarantees and are affected by confidential licensing deals, promotional bundles, and currency conversion. That means the blended number is only as accurate as the input assumptions you choose.
Tradeoff to know: a simple blended model is transparent and reproducible but hides downstream complexity. Use it to compare platforms, not to predict your take-home pay.
A reproducible template you can run yourself
Formula to use: blended gross per stream = paid_share * paid_rate + ad_share * ad_rate. Replace shares with the percentage of your streams from each pool and rates with the gross per-stream values you trust.
| Platform | Paid share | Paid rate (USD) | Ad share | Ad rate (USD) | Blended gross per stream (USD) |
|---|---|---|---|---|---|
| Spotify - ad heavy example | 40% | 0.006 | 60% | 0.0004 | 0.0026 |
| Spotify - paid heavy example | 80% | 0.006 | 20% | 0.0004 | 0.0048 |
| Apple Music - typical | 99% | 0.010 | 1% | 0.0000 | 0.0099 |
Concrete example: if your catalogue gets 70 percent of streams from paid subscribers and 30 percent from ad supported listeners, and you adopt paid and ad rates from the table, plug them into the formula. That produces a blended gross per stream you can multiply by your stream count to estimate gross receipts before rights splits.
Practical insight: changing the paid share by 10 percent can move your blended gross more than switching platforms in some cases. That means marketing to premium subscribers and playlist contexts that drive paid listening is often a higher leverage action than platform hopping.
Where to go next: run the blended formula in a spreadsheet using your actual subscriber mix, add your distributor and publisher percentages, and compare the net numbers to the worked examples in section 4. If you need a checklist for registrations that protect revenue before calculating splits, see our guide on publishing and mechanical royalties at Royalties de l edition musicale vs. redevances mecanicas.
AUTHOR

Charly
Carlos Palop is a seasoned music publishing expert, adept in rights management and royalty distribution, ensuring artists' works are protected and profitably managed. Their strategic expertise and commitment to fair practices have made them a trusted figure in the industry.